
Nov 18, 2022
Failed Pixie Deployment On Civo Kubernetes cloud? Here's How To Fix It
Pixie is a great platform for monitoring telemetry data from your Kubernetes cluster. It provides both UI …

Gone are the days of monolithic applications and siloed data centres. Enterprises are increasingly adopting multi-cloud strategies, with many opting for a hybrid approach. As cloud adoption, microservices, and containerization become the norm, providing unprecedented levels of flexibility and agility, there is a need for a new way of analyzing systems’ behavior.
What is observability in DevOps: In DevOps, observability means having tools and practices in place to easily understand and troubleshoot the performance and behavior of software systems in real-time.
Traditional monitoring tools, with their minute-long data sampling, struggle to provide a comprehensive view of such intricate systems. This lack of visibility can lead to:
Delayed issue identification and resolution
Hesitation in deploying new features or updates
Difficulty in optimizing application performance
This is where observability comes into play. By offering a deeper understanding of your entire application ecosystem, businesses can proactively identify potential issues before they disrupt operations, gain insights to optimize performance and user experience and make informed decisions about future updates (including code updates), repairs, and deployments. It directly aligns with Agile, DevOps, and SRE objectives for faster, high-quality software delivery.
APM ensures smooth application operations and user experiences. Yet, challenges persist in its implementation. Modern application architectures and dynamic cloud environments pose complexities.
Traditional APM struggles to understand how applications work, creating a “black box” problem. Without insight into internal processes, application health monitoring becomes a challenge. Identifying bottlenecks and resolving problems become time-consuming endeavors, leading to extended downtime and inefficiency.
The massive increase in data from applications, network infrastructure, and business tools creates significant challenges. Traditional APM solutions struggle to effectively manage and analyze this vast amount of information, hindering performance and creating operational bottlenecks.
Traditional APM solutions often lock users into specific vendor ecosystems, limiting their flexibility and interoperability. This creates a dependence on the vendor, leaving users vulnerable to issues like software bugs or outages within the vendor’s platform. This can lead to issues like system-wide downtime, affecting critical operations like monitoring and alerting.
APM solutions can become susceptible to security risks, especially during periods of high traffic. Threats like DDoS attacks, data breaches, phishing attempts, and brute-force assaults can compromise system integrity. Traditional APM tools might struggle to handle the surge in requests, worsening security vulnerabilities.
The growing complexity of new application designs that leverage open mainframe services deems traditional monitoring tools insufficient. These tools struggle to gather the required information and provide deep insights to manage the evolving workloads. Failure to adopt a modern monitoring approach can result in unnecessary outages, impacting customer service and business continuity.
Industry trends, too, reflect a growing need for observability. According to a 2023 observability forecast by New Relic, nearly half (49%) of respondents identified security, governance, risk, and compliance as key drivers for adopting observability solutions.
Here’s the reason why. Observability goes beyond traditional monitoring. It provides the capability to automatically detect and understand not only existing issues (known knowns) and potential problems (known unknowns), but also uncover unforeseen issues (unknown unknowns) that arise in complex systems.
Experts at Gartner predict observability to be a dominant trend addressing current monitoring limitations. By 2024, it is estimated that 30% of enterprises utilizing distributed system architectures will leverage observability techniques to enhance the performance of their digital business services.
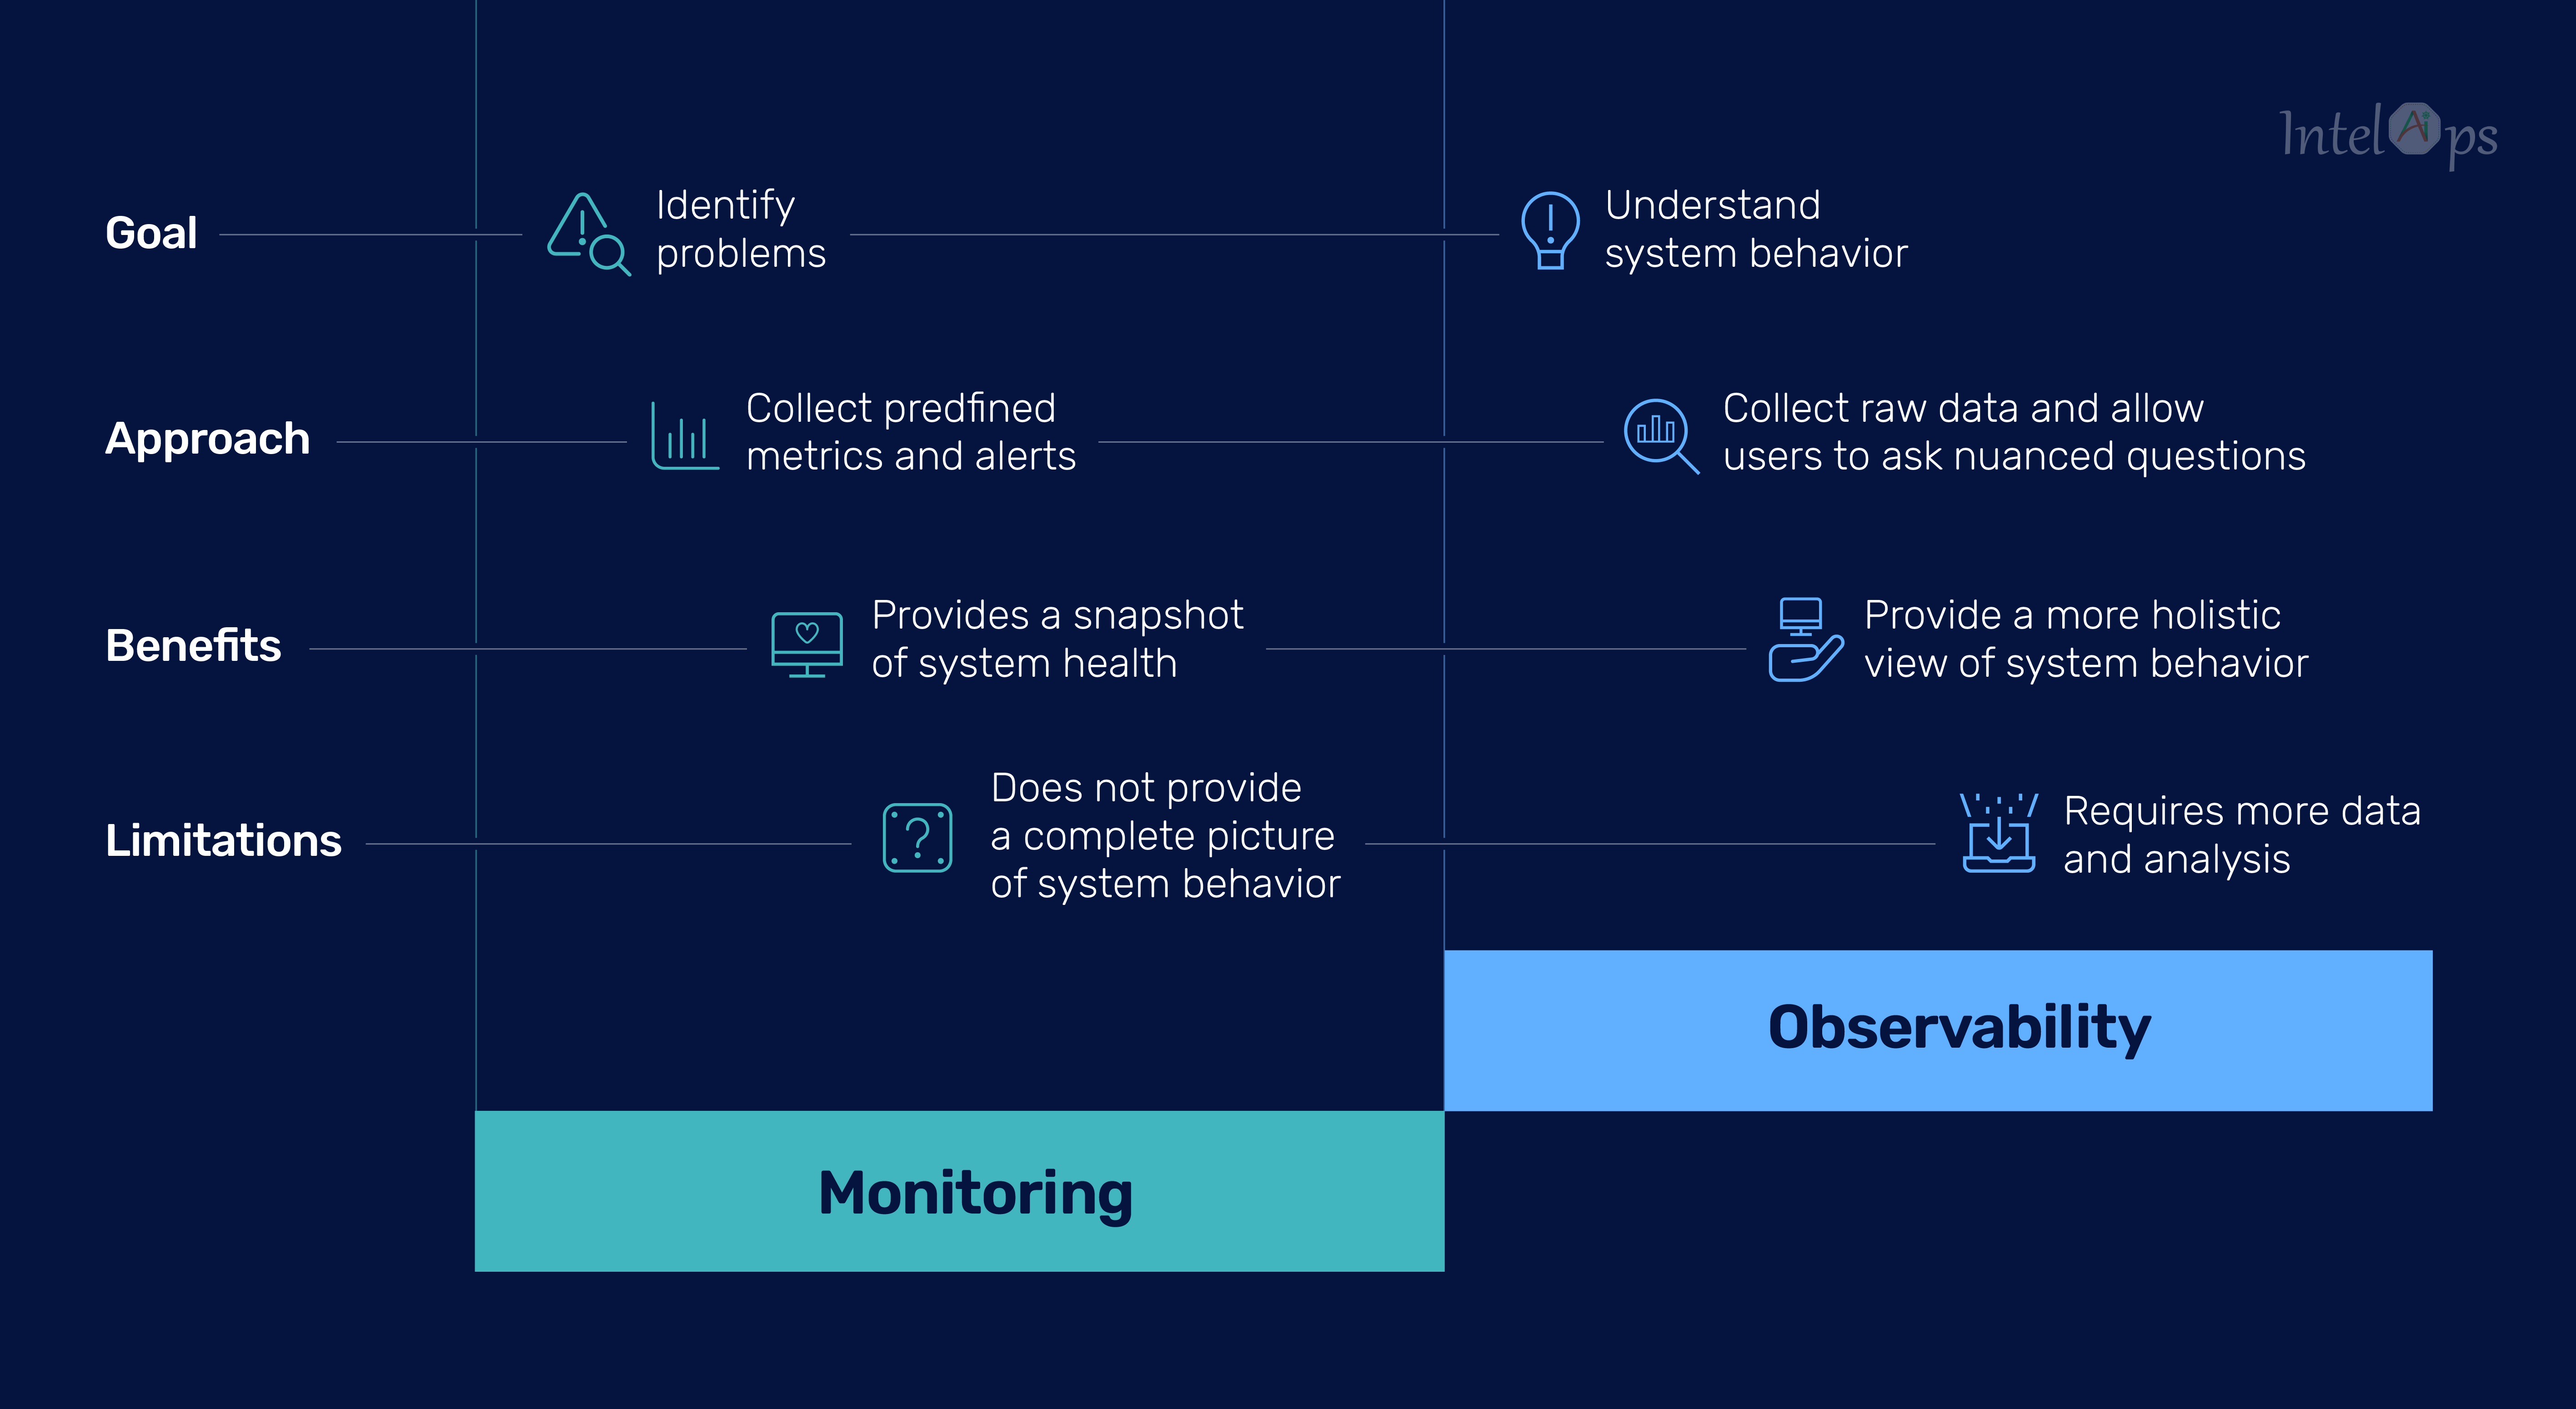
Observability vs monitoring: Monitoring involves tracking predefined metrics and alerts for known issues, while observability is about understanding the internal state and behavior of a system
From front-end user applications to back-end systems, observability provides unified visibility into availability and performance. This detailed insight enables IT operations, development, and network teams to proactively identify and resolve issues.
There are 3 observability pillars: logs, metrics and traces. These components provide unique perspectives on the performance and operation of systems within cloud and microservices environments. When analyzed together, they offer a complete picture of the system, aiding in identifying and resolving issues that impact business goals.
Binary Logs: These utilize formats like pflog, MySQL binlogs, or protobuf. They store data efficiently in a binary format for storage and processing.
Structured Logs: Represented in JSON format, structured logs offer a systematic and organized way of logging events. This format enables easy parsing and analysis of logged data.
Plain Text Logs: These consist of human-readable characters without specific formatting. Plain text logs provide a simple yet effective way of recording events and are readily accessible for review and analysis.
Gauge Metrics: These assess a specific value at a particular moment, like the CPU utilization rate at a given point in time.
Delta Metrics: This type captures variations between previous and current measurements. For instance, it tracks changes in throughput since the last measurement.
Cumulative Metrics: These monitor changes over time. For example, they might track the accumulation of errors returned by an API function call within a defined timeframe, such as the last hour.
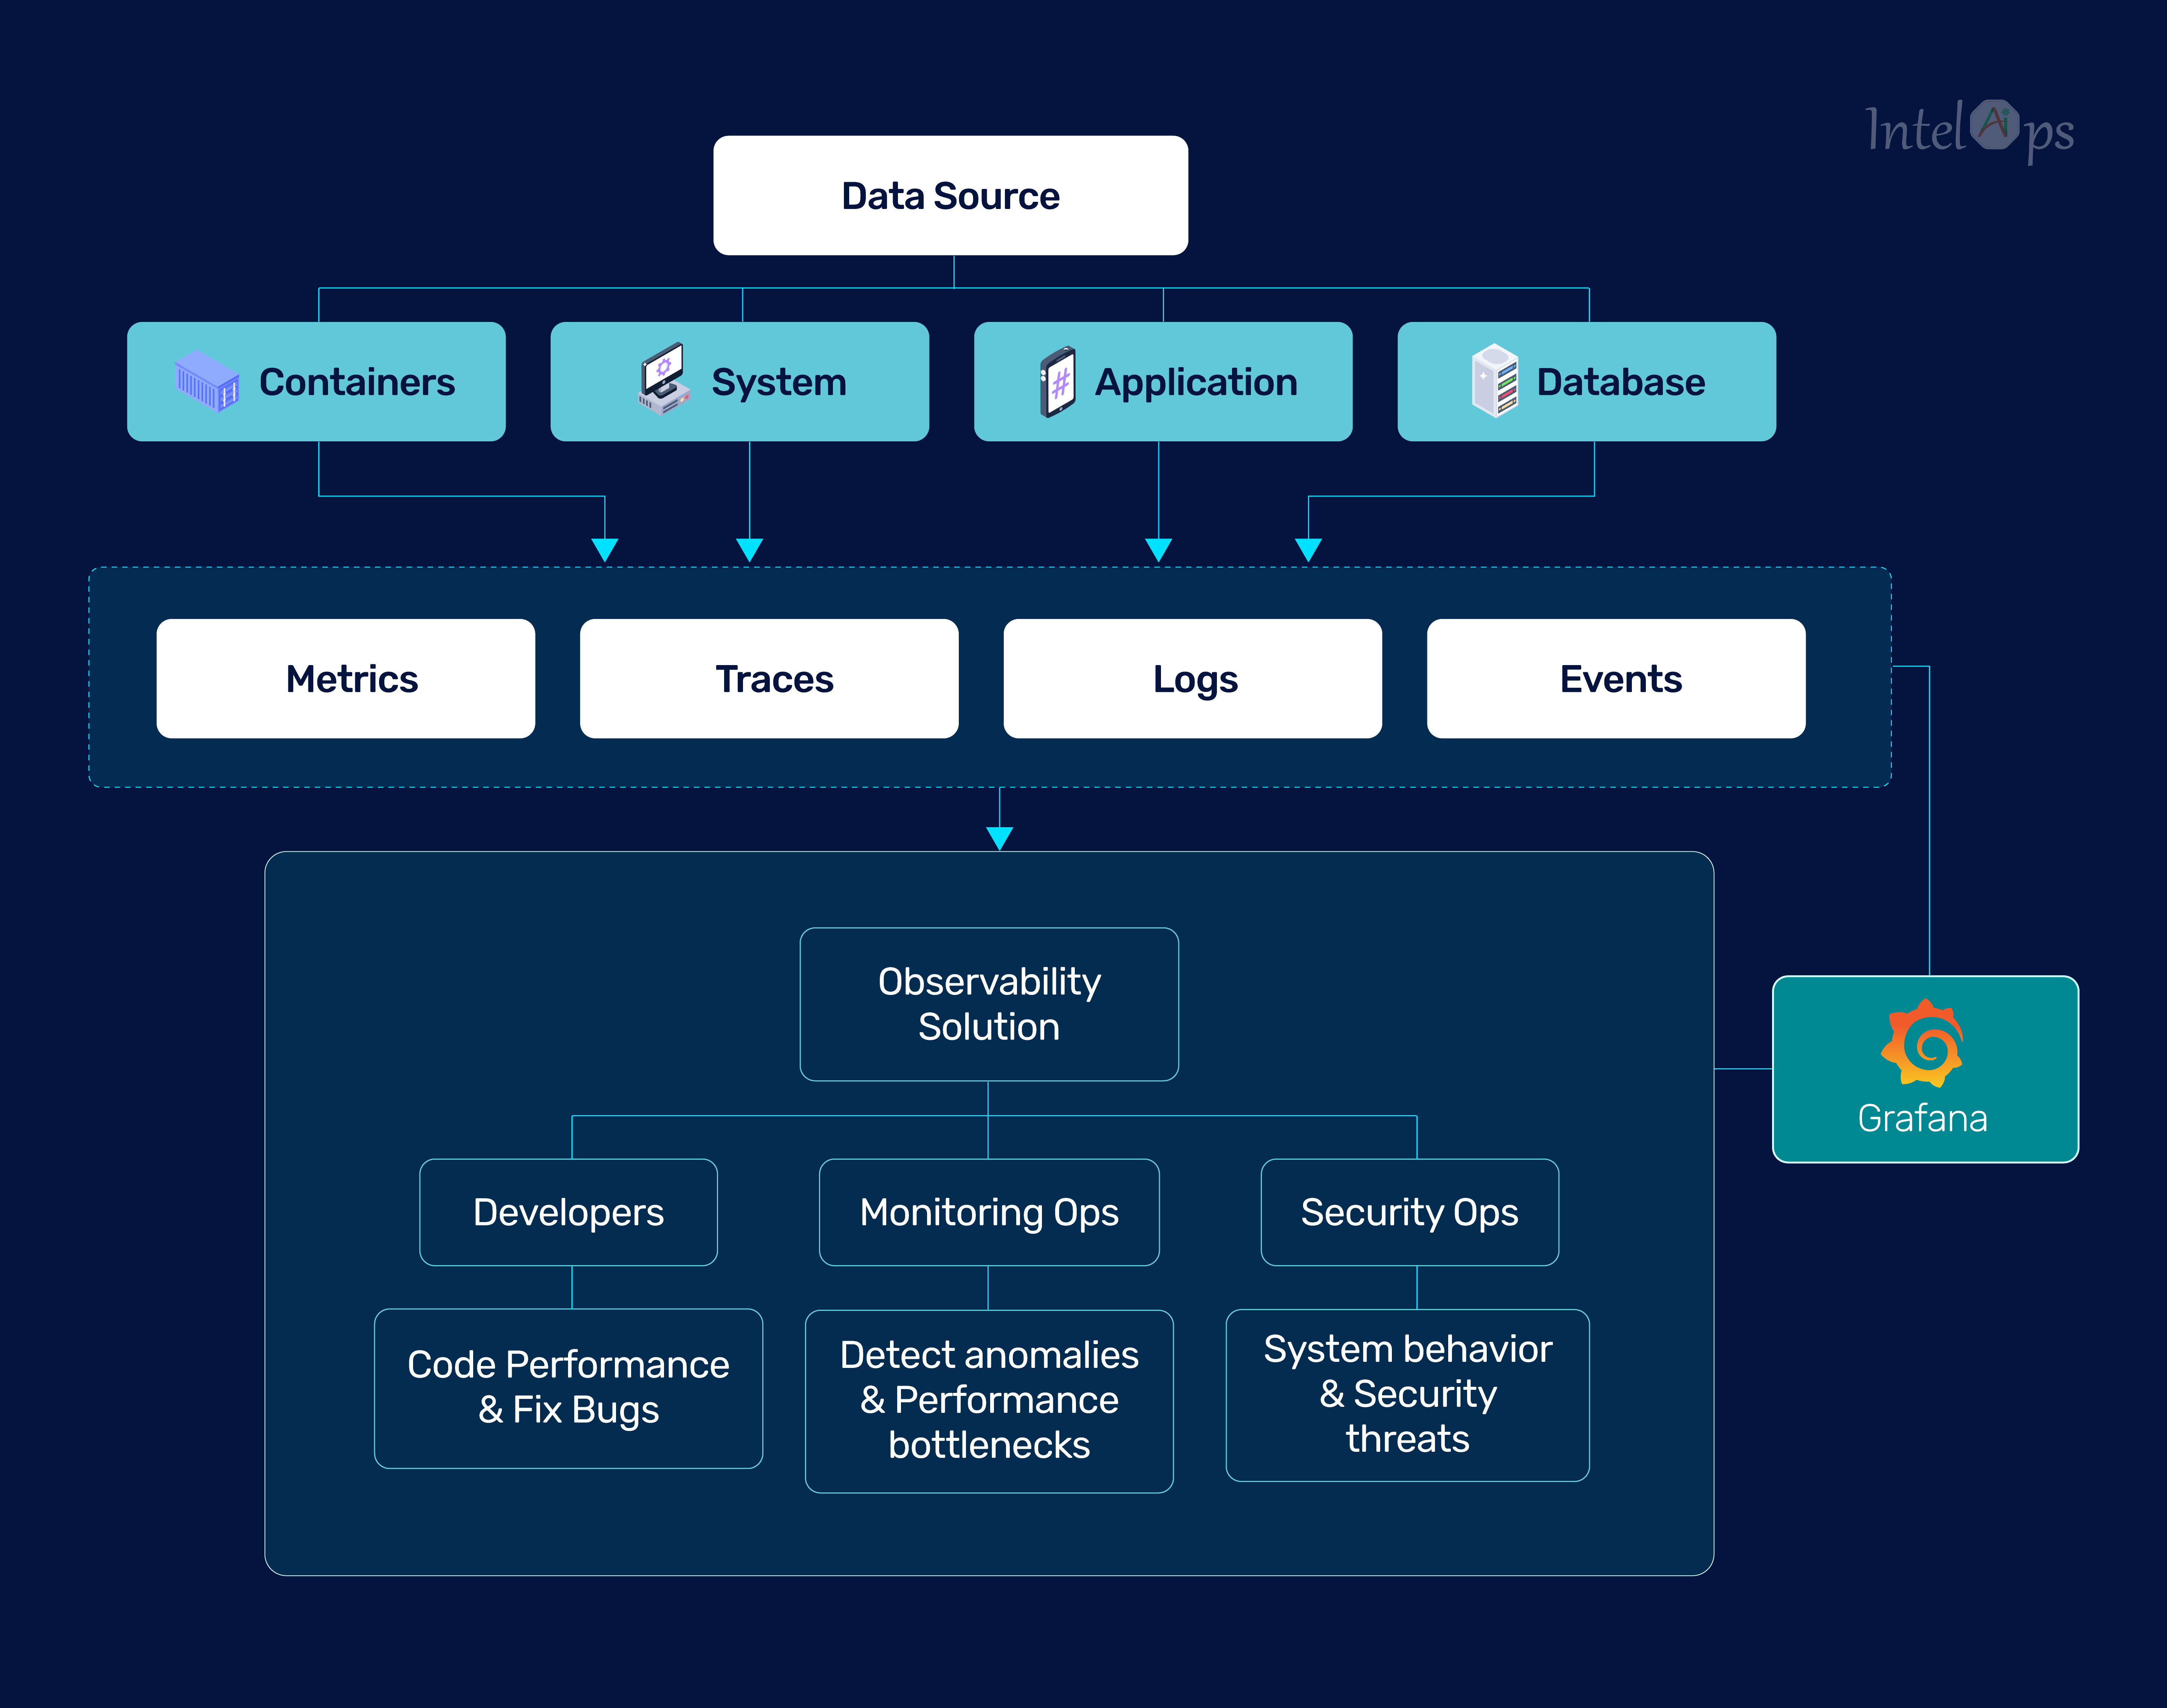
Effective observability combines logs, metrics, and traces for a holistic solution. Integrating these elements, instead of using separate tools, helps developers gain a better understanding of issues and their origins. Companies with unified telemetry data experience quicker detection and resolution times and fewer high-impact outages than those with siloed data.
What is full stack observability: Full stack observability involves monitoring and understanding every layer of a software application, from the front-end user interface to the back-end infrastructure and everything in between, to gain comprehensive insights into system performance and behavior.
Choosing the right observability solution for your complex systems requires solutions that can adapt and scale. The platform needs to:
Analyze system behavior effectively.
Incorporate new environments seamlessly.
Provide comprehensive coverage across your entire system.
KubViz, an observability and monitoring platform built for Kubernetes and DevSecOps workflows, addresses these needs. It delivers real-time tracking of changes and events across various infrastructure components, including Kubernetes clusters, git repositories, container registries, software bill of materials (SBOM), and vulnerability footprints.
Here’s a few reasons why both growing businesses and enterprises prefer our platform:
Unified Observability Platform: KubViz integrates Kubernetes, Git, and container platforms into a single observability solution, eliminating multiple tools and providing a holistic view of the environment.
Enhanced Security and Compliance: KubViz helps mitigate security risks by identifying vulnerabilities, threats, and compliance issues across the software supply chain, ensuring robust security measures.
Improved Resource Utilization and Optimization: With K8s cluster health monitoring and resource allocation optimization, KubViz minimizes wasted resources and reduces operational costs, enhancing efficiency.
Streamlined Collaboration and Developer Productivity: KubViz fosters streamlined collaboration among teams through advanced Git tracking, container monitoring, and visualization tools while also providing actionable insights to enhance developer productivity and streamline DevSecOps practices.
Here’s a quick overview of all that KubViz can do. Get in touch with us at hello@intelops.ai and we will schedule a demo!

Shreya Trivedi is a Frontend Developer and Technical Content Writer.
Pixie is a great platform for monitoring telemetry data from your Kubernetes cluster. It provides both UI …
Gone are the days of simple, monolithic applications running on a centralized infrastructure. Today’s …

Digital transformation has reshaped how businesses operate, keeping customers at the forefront. Its urgency …
Finding the right talent is pain. More so, keeping up with concepts, culture, technology and tools. We all have been there. Our AI-based automated solutions helps eliminate these issues, making your teams lives easy.
Contact Us