
Mar 15, 2024
The Need for Unified Observability for Modern Businesses
Gone are the days of monolithic applications and siloed data centres. Enterprises are increasingly adopting …


OpenTelmetry provides amazing, standardized tools for collecting observability information about your cluster, one of which is a Collector which can receive/process/export data. Vector, on the other hand, is also a very powerful tool for collecting, transforming, and exporting data. Its power comes from the sheer amount of plugins available for it. To combine these two would result in an even more capable data pipeline, as all of your data would be in one place. However, if you try to export OpenTelemetry data to Vector via gRPC, you will likely encounter issues. This blog aims to show how to set up an OpenTelmetry Collector, set up Vector, and connect the two.
We will be using helm to deploy our services to our cluster. This will allow for easy installs/uninstalls. It will also
allow for being able to configure our services via one single YAML file each.
Need to refresh your knowledge on YAML? Take a look at our blog Hacking YAML to your Benefit
The OpenTelemetry Collector (OTel Collector) allows multiple sources including OTLP formatted data, Jaeger, and Prometheus. The data we will be passing into
our OTel Collector will be Pixie data. If you would like a tutorial on how to deploy Pixie on your cluster, take a look at this blog.
There is a helm-chart that is offered by OpenTelemetry, which we will be using.
Deploying the OTel Collector is as easy as running the following commands:
helm repo add open-telemetry https://open-telemetry.github.io/opentelemetry-helm-charts
helm repo update
helm install otel-collector open-telemetry/opentelemetry-collector
This deployment will use the default values.yaml file.
Download this file, rename it to collector_values.yaml, and keep in a folder, as we will be modifying it to redeploy the OTel Collector with our custom values.
At this point, you should set up your OTel Collector’s source correctly. In our case, this means updating the Pixie’s UI with the correct long-term data retention plugin (the OpenTelemetry one).
Deploying Vector is as easy as deploying the OTel Collector. The helm-chart can be found here, while the default values YAML file can be found here. Make sure to save this values file as well, as we will be updating it with our custom configuation, and redeploying Vector. The commands below will deploy the Vector Aggregator:
helm repo add vector https://helm.vector.dev
helm repo update
helm install vector vector/vector --namespace vector --create-namespace
At any point, while Vector is deploying and running successfully, you can check the status of your aggregator’s events using this command:
kubectl -n vector exec -it statefulset/vector -- vector top
Let’s start by opening up the collector_values.yaml file we had saved earlier. In this file, we need to change a few configurations for our OTel Collector to be able to communicate with our Vector
Aggregator.
mode value needs to be changed from empty quotes to “deployment”.config:
receivers:
otlp:
protocols:
grpc:
endpoint: 0.0.0.0:4317
config parameter, we need to set the exporters. We will be exporting to two places, the logs for the OTel Collector pod, and the HTTP connection to Vector.exporters:
logging:
loglevel: debug
sampling_initial: 5
sampling_thereafter: 200
otlphttp:
endpoint: http://vector.vector.svc.cluster.local:80
Here, I have decided to use port 80 to send data to Vector.
4. Within the config.service.pipelines parameter, we need to modify the following:
   pipelines:
     logs: { }
     metrics:
       receivers: [ otlp ]
       processors: [ memory_limiter, batch ]
       exporters: [ otlphttp, logging ]
     traces:
       receivers: [ otlp ]
       processors: [ memory_limiter, batch ]
       exporters: [ otlphttp, logging ]
helm upgrade otel-collector open-telemetry/opentelemetry-collector -f collector_values.yaml
Now, let’s move on to modifying the vector_values.yaml file to modfiy the configuration for our Vector Aggregator.
role parameter needs to be set to “Aggregator”.service.ports parameter, we need to expose port 80 for our otlp (OpenTelemetry) data to flow in:ports:
- name: otlp-http
port: 80
protocol: TCP
targetPort: 80
customConfig parameter, we provide our custom configuration for the Vector Aggregator we are going to deploy.customConfig:
api:
enabled: true
address: 127.0.0.1:8686
playground: true
sources:
otlp-http:
type: http
address: 0.0.0.0:80
# this path is automatically added by OpenTelemetry.
# this is because we are exporting metrics, so it adds a default path.
# The path can be changed/set in the collector_values.yaml file.
path: /v1/metrics
encoding: text
sinks:
stdout:
encoding:
codec: json
inputs:
- otlp-http
target: stdout
type: console
Here, we are receiving input (sources) from our OTel Collector, at localhost:80. This has a path /v1/metrics appended to it by the OTel Collector itself.
For sinks (exporters) we are defining one exporter, standard output (stdout). This will take the data from our HTTP connection, and output it in the form of logs within our Vector Aggregator pod.
4. Now you have configured all that is necessary for Vector to be able to get data from the OTel Collector. We can upgrade our Vector deployment with the new values, using the following command:
helm upgrade vector vector/vector --namespace vector --values vector_values.yaml
At this point, with both the OTel Collector and the Vector Aggregator deployed, we should start seeing data flowing from one to the other. Run the command below to see how many events Vector has seen:
# if on Windows, run in Admin PowerShell
kubectl -n vector exec -it statefulset/vector -- vector top
Which should give you an output similar to this:
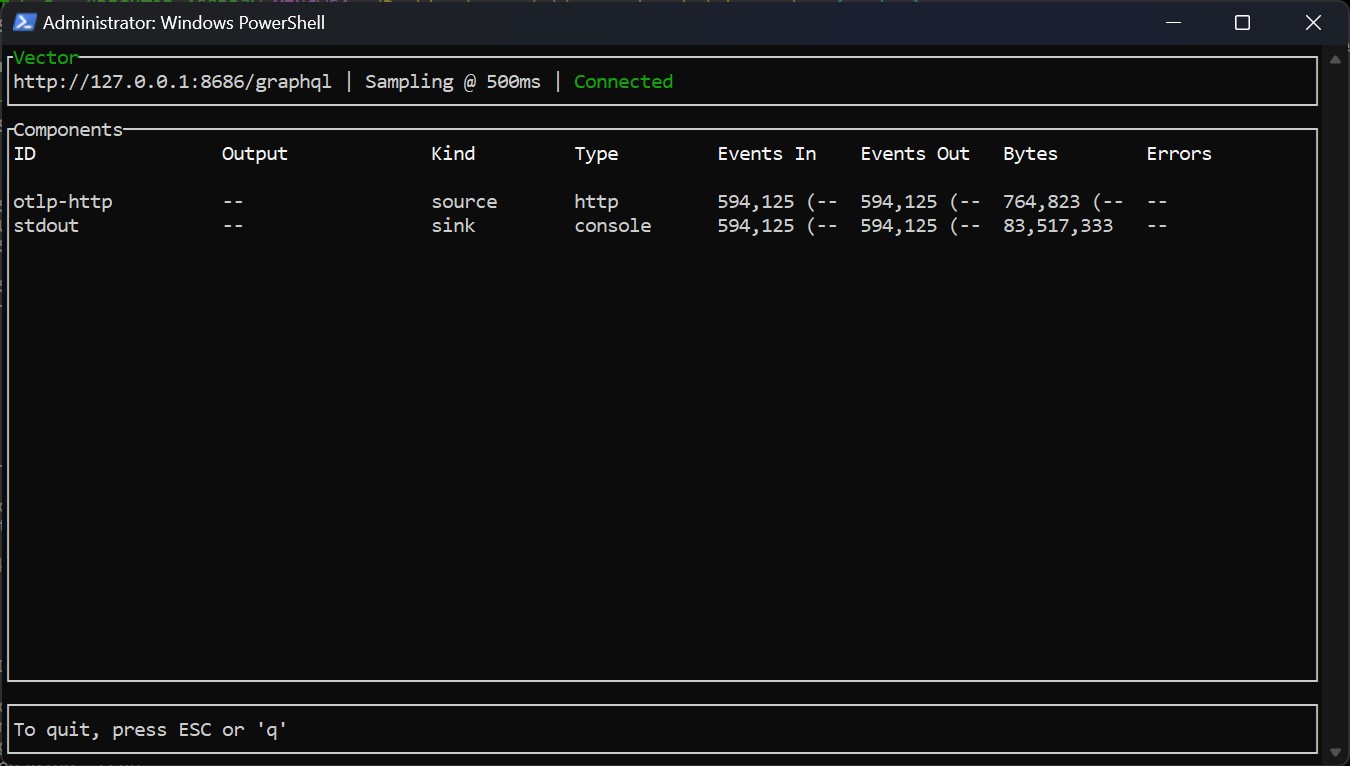 Horray! We have finally got the data flowing.
In this blog, we have explored how to export data from an OpenTelemetry Collector to a Vector Aggregator. This is done using HTTP, as support for OpenTelemetry over gRPC has not been added yet to Vector.
We hope that a solution gets created, but until then, feel free to use this workaround.

Hannan Khan holds a Masters in Computer Science from UT Arlington, with a specialization in Intelligent Systems. His passions include …
Gone are the days of monolithic applications and siloed data centres. Enterprises are increasingly adopting …
Digital transformation has reshaped how businesses operate, keeping customers at the forefront. Its urgency …
Gone are the days of simple, monolithic applications running on a centralized infrastructure. Today’s …
Finding the right talent is pain. More so, keeping up with concepts, culture, technology and tools. We all have been there. Our AI-based automated solutions helps eliminate these issues, making your teams lives easy.
Contact Us